
Making MandelBrot-Set with Excel.

Yes, that is click-bait … This is what I thought when my professor said you will be making Mandelbrot set in Excel !
But considering the computing power of my laptop and Excel, I was convinced. Ps: I did it on my friend’s laptop as Linux doesn’t have any good Excel alternative ( fact 1 - I use Manjaro as my daily Driver ( except for gaming duh ) while writing this blog)
We were able to pull off this Mandelbrot in excel using 10 Iterations and going more than this makes your system awestruck .. it freezes.
This was the load on the CPU when I tried to load the Excel file. (fact 2 The file size is ~60 MB)


These are not some machine codes(not with decimals of course) it is the computation that happens based on the formula which we give in the table.
When all the computations are working well, you will get this as the result!

Not bad for an Excel Computation. Though we cannot zoom into it and get a mind-gaze experience like this, this still is good for me at least.
The Computation
The Mandelbrot set is a mathematical set of points that are defined using a complex number system. The math behind it involves iterating a complex function, which is defined as follows:
\[f(z) = z^2 + c\]Where $z$ is a complex number and $c$ is a constant. The function is iterated over and over again, with the result of the previous iteration being used as the input for the next iteration. The iteration stops when the absolute value of the result is greater than 2, or when the iteration count reaches a maximum value. The number of iterations it takes for the absolute value to exceed 2 is the number of times the point is in the Mandelbrot set.
In other words, the Mandelbrot set is the set of all complex numbers “c” for which the sequence of numbers f(0), f(f(0)), f(f(f(0))), etc. remains bounded in magnitude. This means that the magnitude of the numbers in the sequence never grows larger than a certain value (which is usually set to 2).
The Mandelbrot set can be visualized by plotting the complex number “c” on a complex plane and coloring the points according to whether or not the corresponding sequence remains bounded. This produces a beautiful and intricate pattern, which has been studied extensively by mathematicians.
Iterating manually using Excel
I took numbers from -2 to +2 with a step size of 0.01 for rows and columns


Then we use the data table from excel to fill up those rows and columns which get formed by the above 2 images.
We use the cells B1 and C1 in the Data Analysis tool

It would look like this in the first iteration.
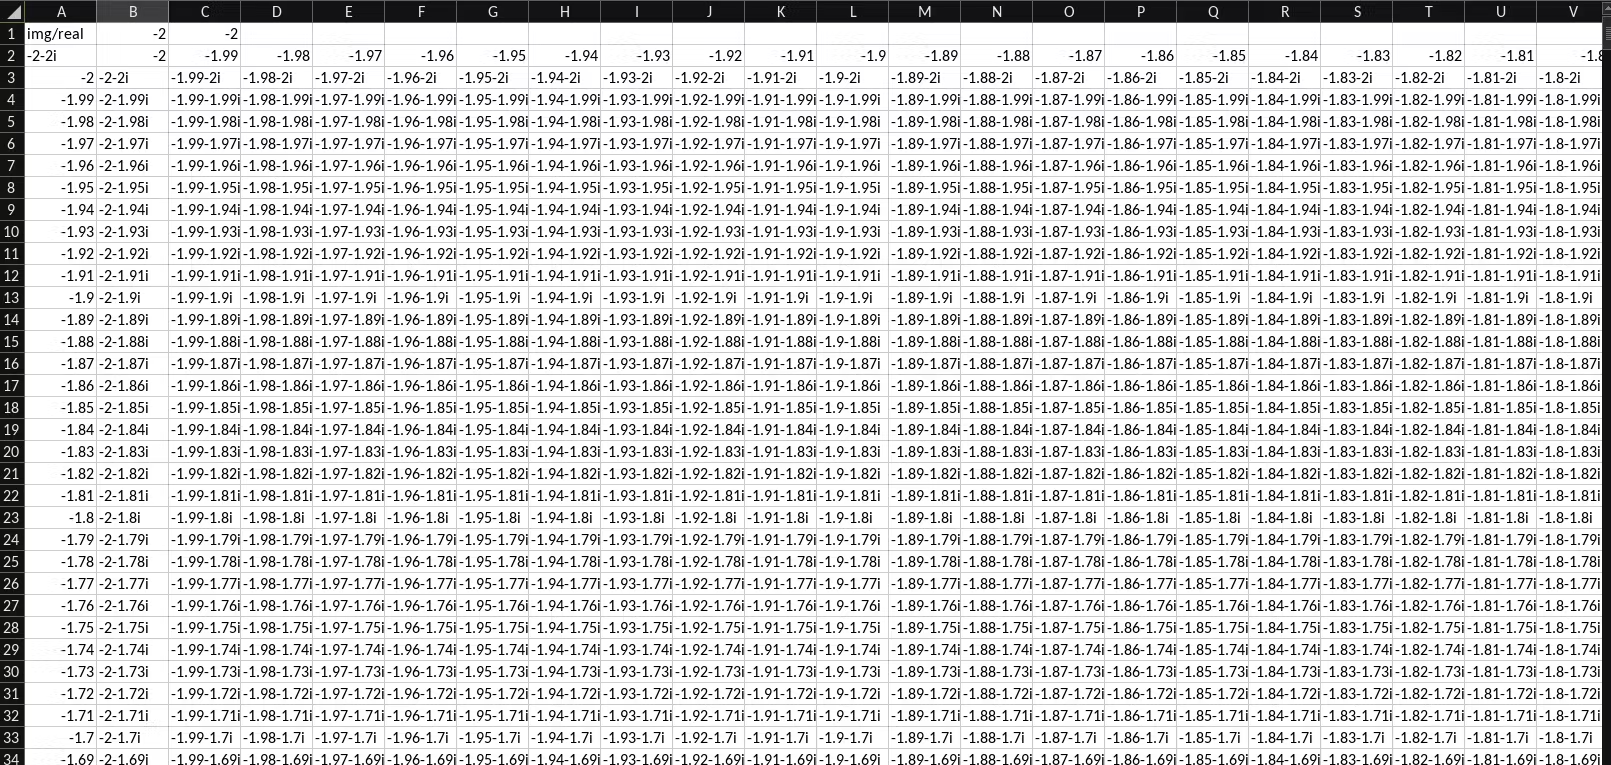
Use this formula for
=IMSUM(IMPRODUCT(B3,B3),B3) The second iteration will look like this
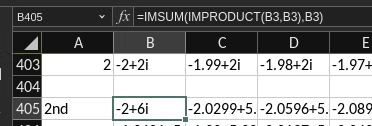
Now make a new sheet and put this formula at A1
=IMABS(Sheet8!B3615)And reduce the height and width of cells to make the Mandelbrot visible! It will be without colors, you can change the style of the sheet. Just select all the cells and make a sheet color format and set if the cell value < 2 color it with black.

When everything goes well , the final sheet after zooming out should look like :
That’s it ! You made fractal using Excel !